General description
PTMcode is a web resource for exploration of known and predicted functional associations between post-translational modifications (PTMs) within proteins. In its first release it contains 13 different PTM types. PTM types are abbreviated in a two letter code as: Ph (phosphorylation), NG (N-linked glycosylation), Ac (acetylation), OG (O-linked glycosylation), Ub (ubiquitination), Me (methylation), SM (SUMOylation), Hy (hydroxylation), Ca (carboxylation), Pa (palmitoylation), Su (sulfation), Ni (nitrosylation) and CG (C-linked glycosylation). These PTMs are present in 25,765 proteins of 8 different eukaryotes.
The database is focused on the exploration of the global post-translational regulation of proteins, not only by describing the set of its modifications, but by identifying the functional associations among the PTMs present in the protein. To do that, we combine five different evidence channels based on a literature survey, the modified residue co-evolution, their structural proximity, their competition for the same residue and the location within PTM highly-enriched protein regions (hotspots) and show the functional associations within the context of the protein architecture.
Browser requirements
PTMcode relies on Adobe Flash and Javascript for full functionality. Any modern browser which supports Flash should work fine. Visit to Adobe's Flash pages to install or update the Flash plugin for your browser. PTMcode requires Flash version 11.1.0 or greater.
- Linux/Unix: Chrome, Firefox and Opera work fine
- Windows: Microsoft Internet Explorer 9 or later, Chrome, Firefox and Opera work fine. Even though many PTMcode features will work in Internet Explorer version 8 or lower, we do not support them, or plan to make the site fully functional in those browsers.
- OS X: Chrome, Firefox, Opera and Safari all work without problems.
PTMcode does not use browser cookies at the moment.
Functional associations between PTMs
PTMcode aims to provide a global picture on the post-translational regulation of a protein by means of the co-regulation between its different modifications. A functional association between two PTMs is broadly defined here, from the physical interaction between two modifications or their competition for the same site to the participation in the same functionality even in they do not happen at the same time. To catch all these possible situations, we combine five different channels of evidence based on different approaches that we explain deeply below.
Co-evolution
|
We used the co-evolution of two modified residues to predict their functional association as described in Minguez et al 0212. We measured the co-evolution between any two modified sites in a particular protein using the mutual information (MI) algorithm (see explanation in the figure below) and extracted those pairs that are significantly co-evolving in comparison to random expectation. Co-evolving score based on MI: Two PTMs (acetylation in blue and phosphorylation in red) are pairwise evaluated in three different situations in which both residues are present in half of the orthologs from 10 species. The score includes the capacity of MI to address the level of dependency of two variables (maximum in both the right and left sequence alignments), and the degree of conservation of the amino acid across the species in the alignment (which is maximal in the left coupling). |
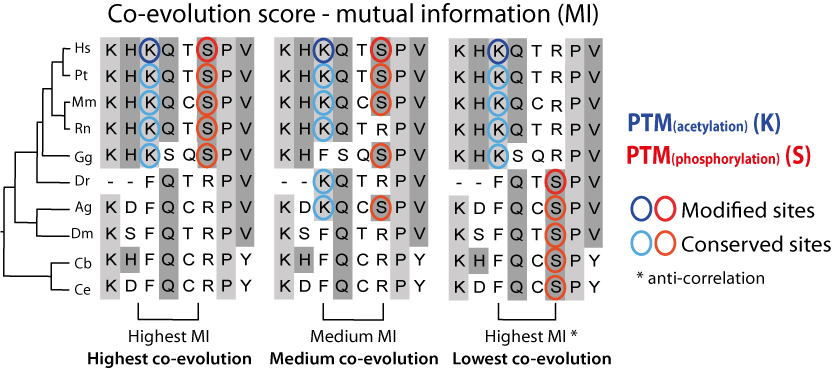
Co-evolving score based on MI (click to enlarge) |
Structural distance
A straightforward mechanism of two PTMs to be associated is based on their proximity, measured here using the 3D structure of the protein. If they are close enough, they could be either competing for the same space. We mapped PTM residues to three-dimensional structures of proteins from the Protein Data Bank and calculated the spatial distance between pairs of modified residues. To delineate a first estimation for an appropriate distance to conclude physical interaction we measured the average distance for twelve pairs of associated modifications reported in the literature to physically interact. Thus, modified residues closer than 4.69 Ångströms are predicted to either be physically in contact or being mutually exclusive competing for the same protein niche.
Competing PTMs
Another mechanism for a direct crosstalk of two PTM would be their competition for the same residue, which implies that they are mutually exclusive at a given time.
Manual annotation
PTMcode not only holds predicted associations, but also PTM sites that are reported in the literature to crosstalk.
Hotspots
|
PTMs can also be part of regulatory hotspots, small regions in the protein sequence that are enriched in modifications. According to Beltrao et al 2012 modified lysines are more probably located within a distance of 15 amino acids to a phosphorylated residue therefore forming hotspot regions where PTMs tend to cluster. Thus, using this threshold, for each of the modified residues in a protein we define a window of 31 amino acids (15 downstream and 15 upstream), count the number of modifications there and compared them using a Fisher exact test to the number of modifications in the whole protein. Overlapping hotspots where then merged. Hotspots are mapped into the interactive protein representation that PTMcode generates. A red line is displayed between the scale and PTMs as shown in the figure on the right. Clicking the hotspot regions will highlight them in the interactive view, and display a table with all the PTMs within it. |
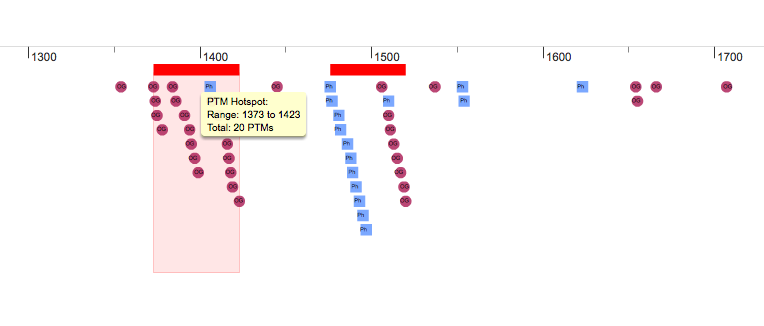
PTM hotspots (click to enlarge) |
Browsing the PTMcode database
|
The known and predicted functional associations between two of the available PTM types of modifications are accessible by selecting any two PTM types in an interactive network that offers all possible connections (see image on the right). The connections here are constrained by the fact that both modifications at least should happen in the same protein. The PTM types are represented here by symbols, consistent over the whole PTMcode framework, the size of which corresponds to their relative abundance in the database. The link widths represent the number of proteins modified by the two respective PTM types normalized by the total number of proteins harboring the less abundant PTM type. The width thus indicates relative coverage of the particular pair-wise functional associations. Upon selection in the web interface, two types of modifications are activated and all the pairs of known and predicted functional associations in all proteins are shown in a table (see below) where each of the entries can be further explored. These tables are available to download as plain text files. |
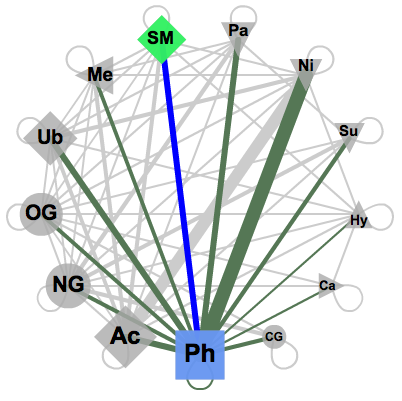
Network (click to enlarge) |
|
All the functional associations between phosphorylation and SUMOylation are shown in a table sortable by any of the columns. Clicking in any of the proteins, the protein box in the search form is filled up and user can explore all the functional associations for this particular protein. The table contains information about the conservation of the modified residues and the evidences supporting the predictions. See conservation score explanation below for more details. Within the table, users will also see whether the modification is part of a hotspot. See more information about hotspots above. |
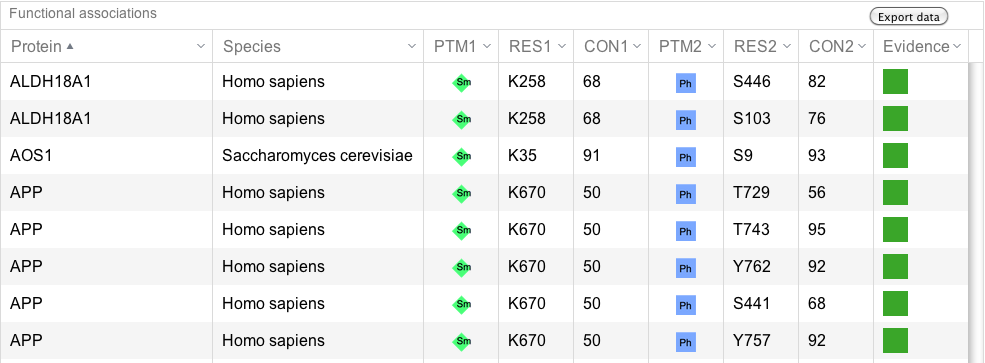
PTM information table (click to enlarge) |
Searching the PTMcode database
PTMcode has a protein-centric approach. Our aim is to provide predicted models for the post-translational regulation of proteins from eukaryotes (8 in the first release). Thus, we provide the users with a search form where they can introduce their protein of interest (all commonly used protein IDs are supported and a protein sequence can also be submitted) and even restrict the retrieved model to a particular amino acid (should be a modified residue) or to a region of interest. Users can also restrict the regulation model by the PTMs of interest by checking the individual types in the select option.
Once the Explore protein button is pressed, the predicted model will be retrieved in the form of an interactive image. The protein backbone is represented by a straight grey line with protein globular domains and unstructured regions extrated from the SMART database displayed on top. SMART domains and other features are clickable and will redirect user to the corresponding entry in the SMART web server, with detailed information about the domain. Below the protein representation, all the PTMs are mapped following a shape/color code. On the top left corner PTMcode provides a draggable functions box allowing users to zoom the image, show/hide all PTM associations or save the currently displayed picture as a bitmap image.
The interactive image of the protein's regulation model
|
Below the protein representation, all the PTMs are mapped
following a shape/color code. On the top left corner PTMcode
provides a menu where users can:
A second menu on the top right corner gives the possibility to filter the functional associations shown in the image according to the evidence channel they belong to. To remove the current selection, simply click again in the evidence selected. Pressing the Display all associations button, PTMcode will display all the functional associations. The associations are color coded according to the evidence channel that retrieved them. See a a global representation on the right. Clicking in any of the modifications will show the functional associations for that particular PTM, see two examples on the right. Selecting any PTM will also display a table where all functional associations can be further explored. The table provides information about all the PTMs predicted to be functionally coupled to the one selected which shows information about the conservation score (see details) and the evidence channels for each of the functional associations. Moreover, users may visualize the two PTMs associated within the 3D structure of the protein (when available) by clicking the Highlight in structure button which will pop up the Jmol plugin with full Jmol functionality. Clicking in any of the entries in the table will highlight that particular association in the interactive image as well. The evidence channels are color coded and clicking in each of them will display more information about each of the predictions within a pop-up window. For instance, from the co-evolution evidence pop-up, users can explore the multiple sequence alignment (using Jalvivew) from the orthologous group where the co-evolution analysis was performed. In the Jalview alignment, the two columns of the analysed residues are highlighted (take note that the residue number in the alignment will correspond to the alignment position, not the position in the protein). Within the table, users will also see whether the modification is part of a hotspot. See more information about hotspots. |
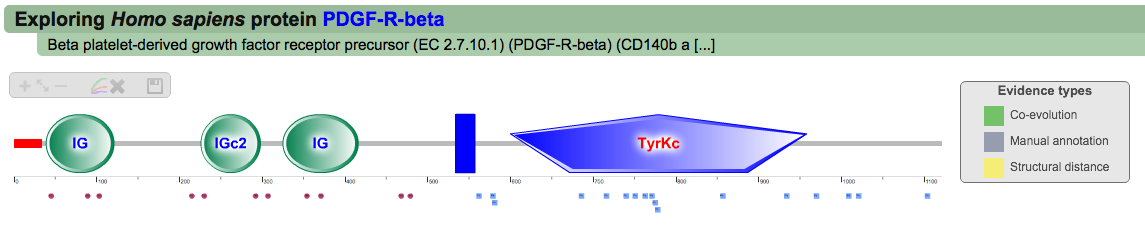
Default protein display (click to enlarge) 
All PTM associations (click to enlarge) 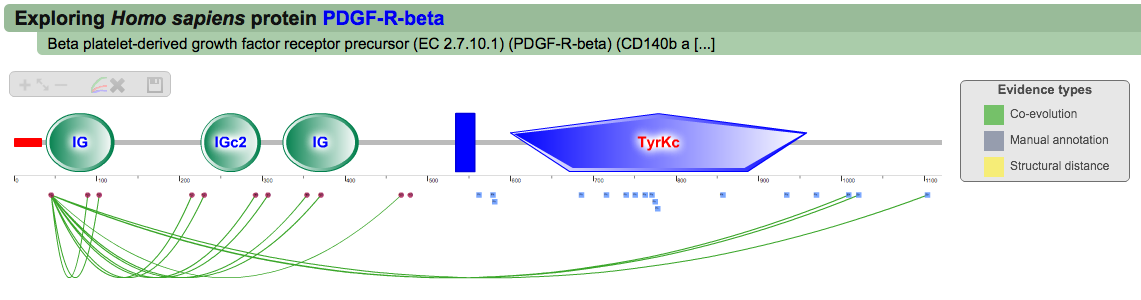
Single PTM functional associations (click to enlarge) 
Single PTM functional associations (click to enlarge) 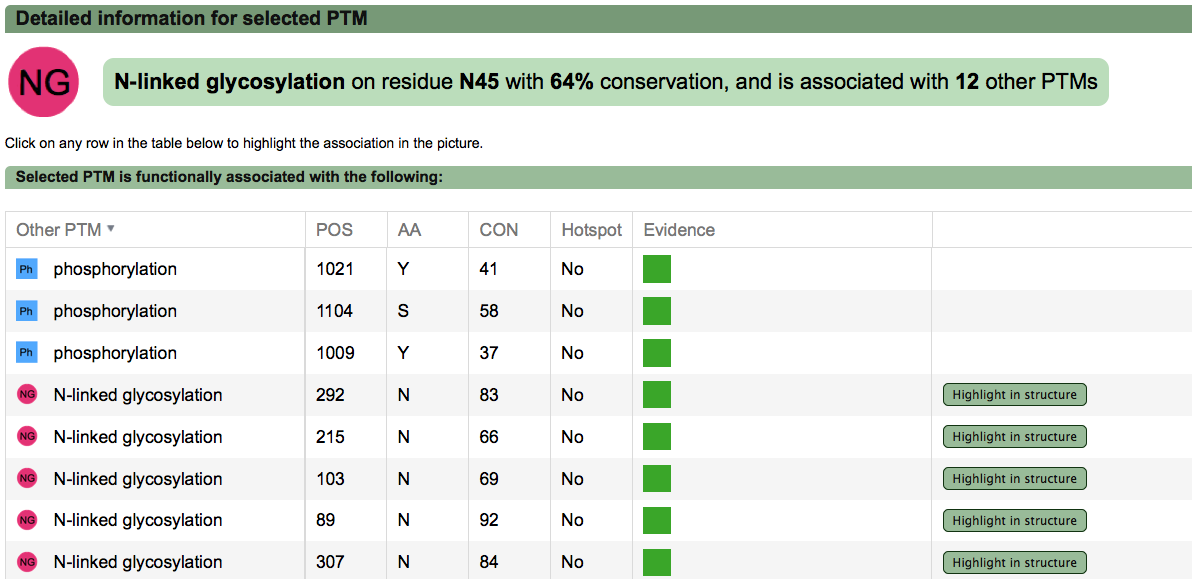
PTM functional associations details (click to enlarge) |
Conservation score (RCS and rRCS)
|
PTMcode gives a score (the rRCS, relative Residue Conservation Score) to measure the conservation of the modified residue within the protein, it is shown under the column "CON" in the results table and is calculated as defined in Minguez el 2012. The rRCS is a score (given in the form of a percentage) that measures the conservation of the modified residue compared with the same type of amino acid in the same type of protein regions (ordered or disordered regions). A rRCS > 95 means that the modified residue is more conserved than the 95% of the same amino acids within the same type of protein region. A "CON" column with a 0 means that we where not able to calculate the conservation score for that particular modification. The actual value that gives the conservation, the RCS (Residue Conservation Score, not shown within the results table) is composed of two components: the MBL (Maximum Branch Lenght) that is the longest evolutionary distance among species that contain a conserved modified residue and the RCR (Residue Conservation Ratio) that quantifies the conservation ratio of the modified residue across the species in a taxonomic group in which a least one conserved site residue has been observed. In the figure below, the score is illustrated by a modified serine (circled) within a column of a MSA of orthologs where the species with the longest branch length containing the residue are Macaca mulatta and Rattus norvergicus; In the respective taxonomic group, 3 out of 4 species maintain the serine in the same position and thus the RCR is 0.75. |
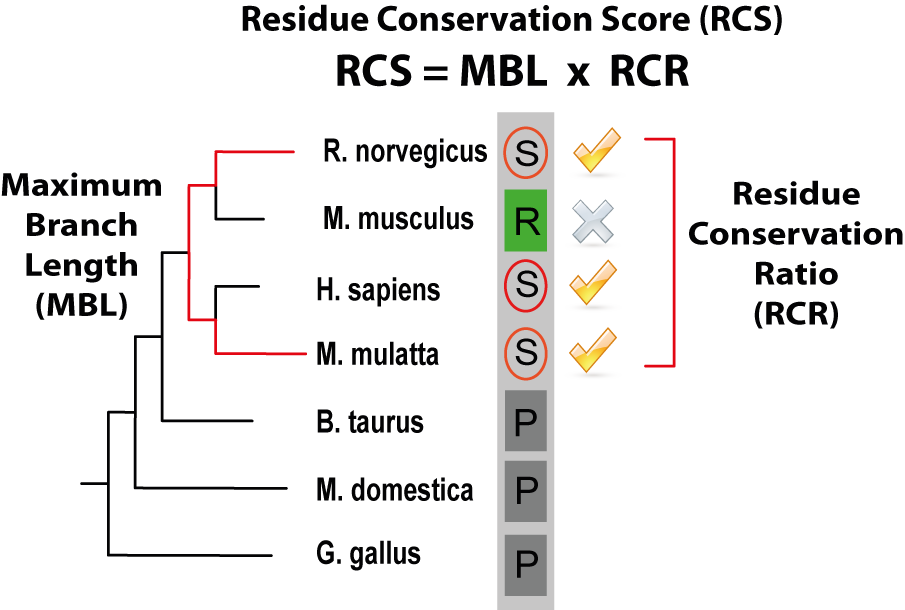
Residue Conservation Score (RCS) (click to enlarge) |